WPC Crunching the Numbers
Envisioning a More Inclusive Future
Like many institutions across the country, we at W. P. Carey put ourselves under the microscope to examine ways we can do better to create a more just, equitable, diverse, and inclusive school. In that spirit, we launched a standing diversity, equity, and inclusion (DEI) committee to address longstanding and emerging places where we can improve. These numbers help show where we are right now. You can learn more about our efforts and progress at wpcarey.asu.edu/dei.
Commitments to diversity, equity, and inclusion
We embrace open access to education and opportunity for all students as being central to our mission.
We believe that diversity is a necessary part of excellence, and reject any false opposition of diversity and merit.
We support robust and respectful discussion of the most pressing issues in society from the wide variety of perspectives in our community.
We respect, listen to, and center the voices of marginalized groups, and recognize that the impacts of our actions matter more than the intention.
We are unequivocal in our support of underrepresented and historically marginalized groups, and will not tolerate discrimination or hate.


Faculty and staff training opportunities

SafeZONE training in support of the LBTQIA+ community

DEI Lunch & Learn series in partnership with the Center for the Study of Race and Democracy

Starbucks/ASU “To Be Welcoming” training

DREAMzone training in support of our undocumented, DACA, and students with families of mixed immigration status


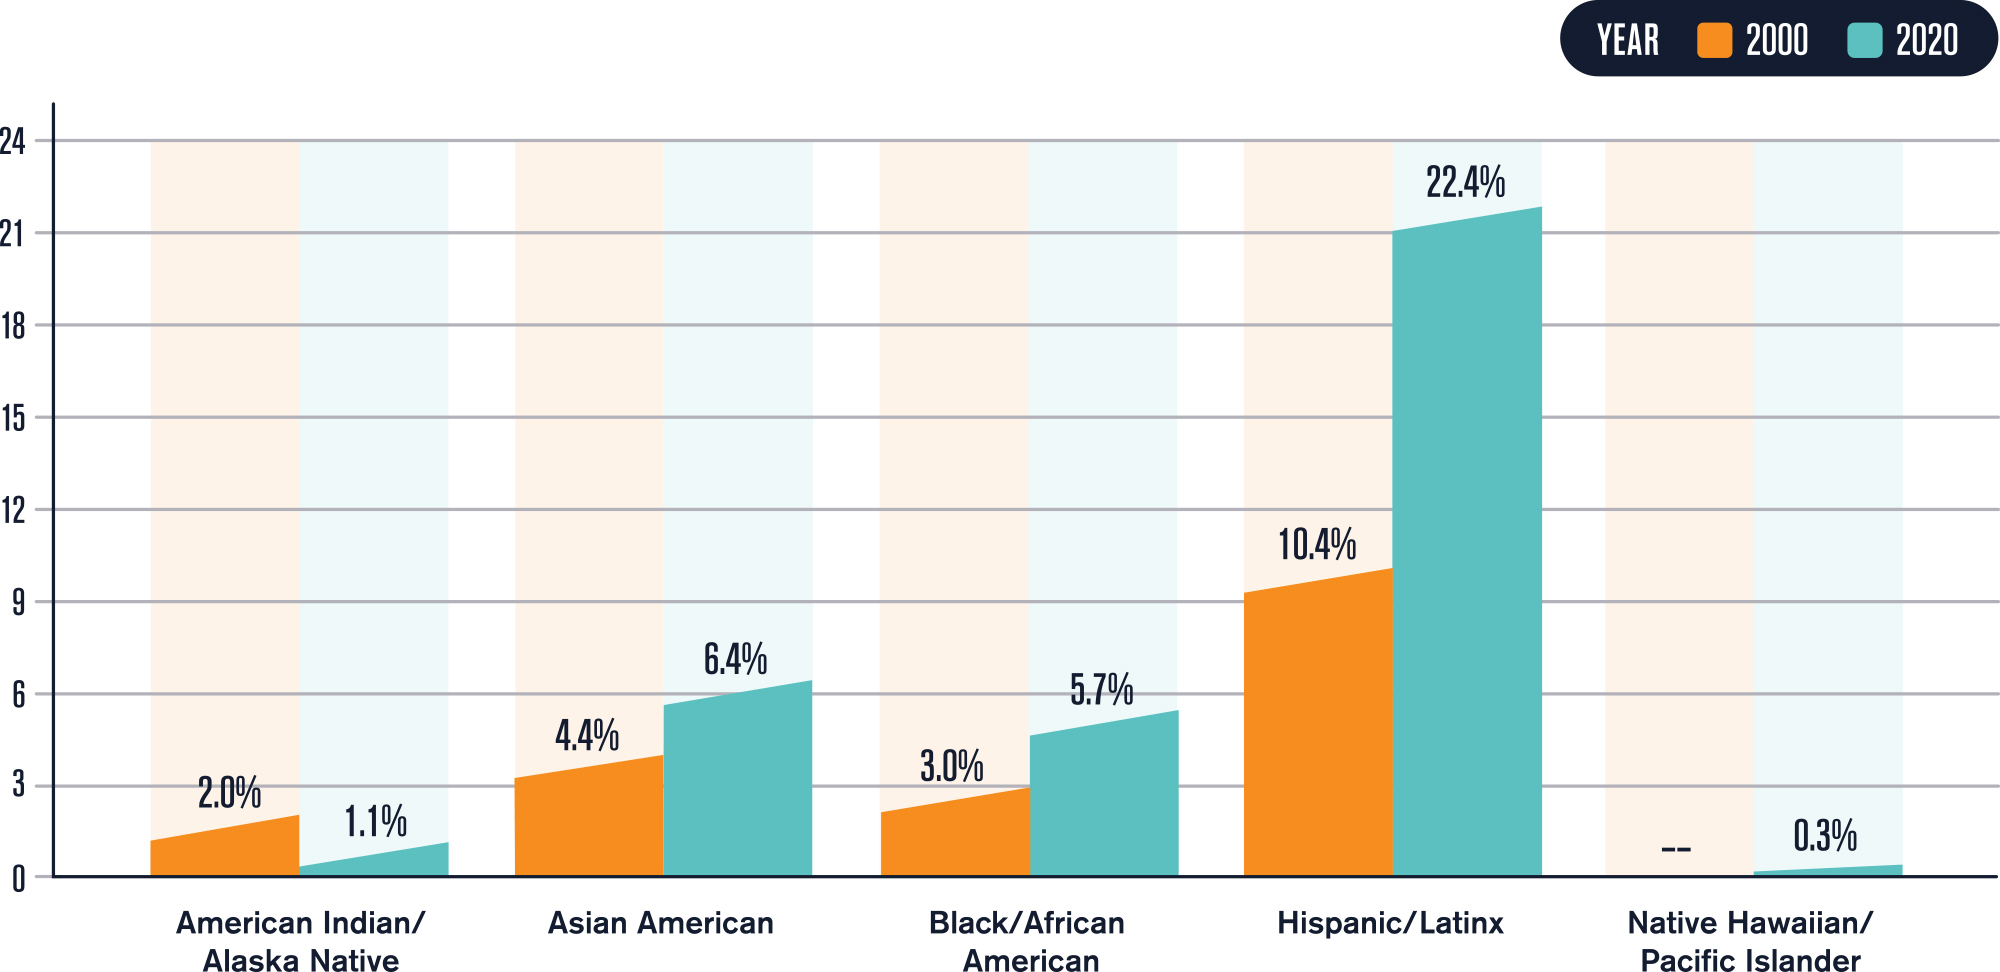
W. P. Carey in the numbers
There are more than 40 student groups at W. P. Carey, including resource groups for students from a variety of backgrounds.
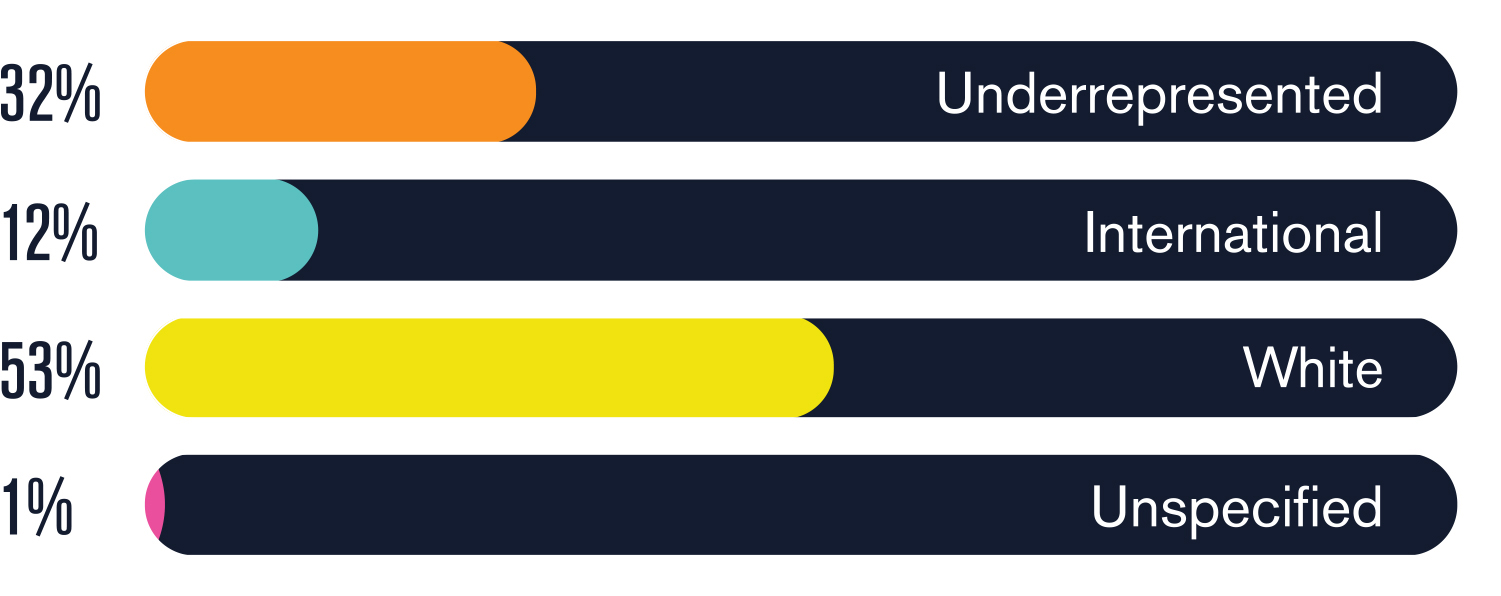
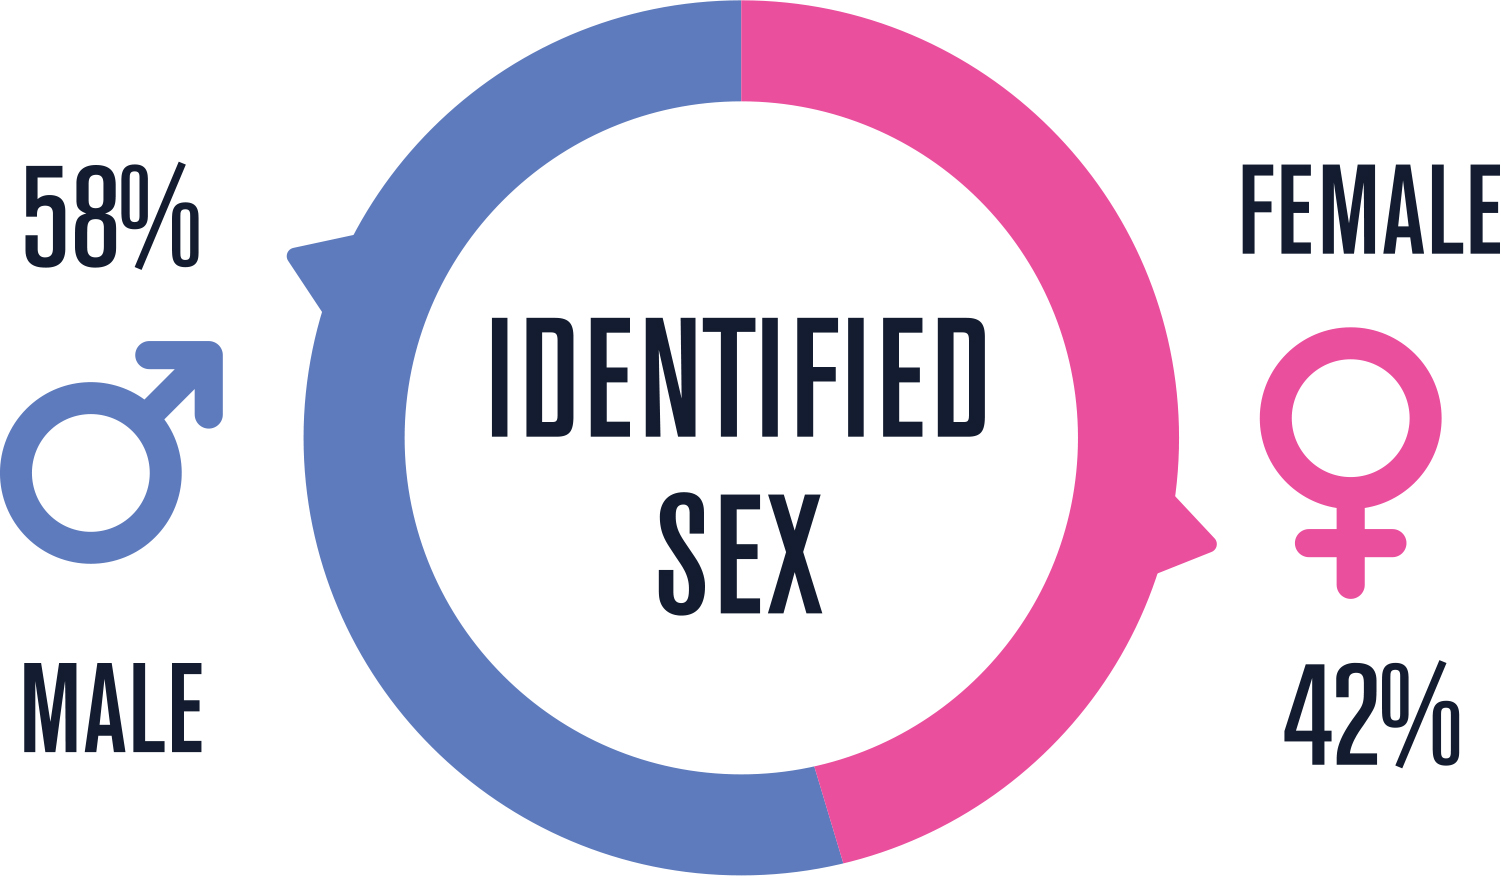
Student demographics
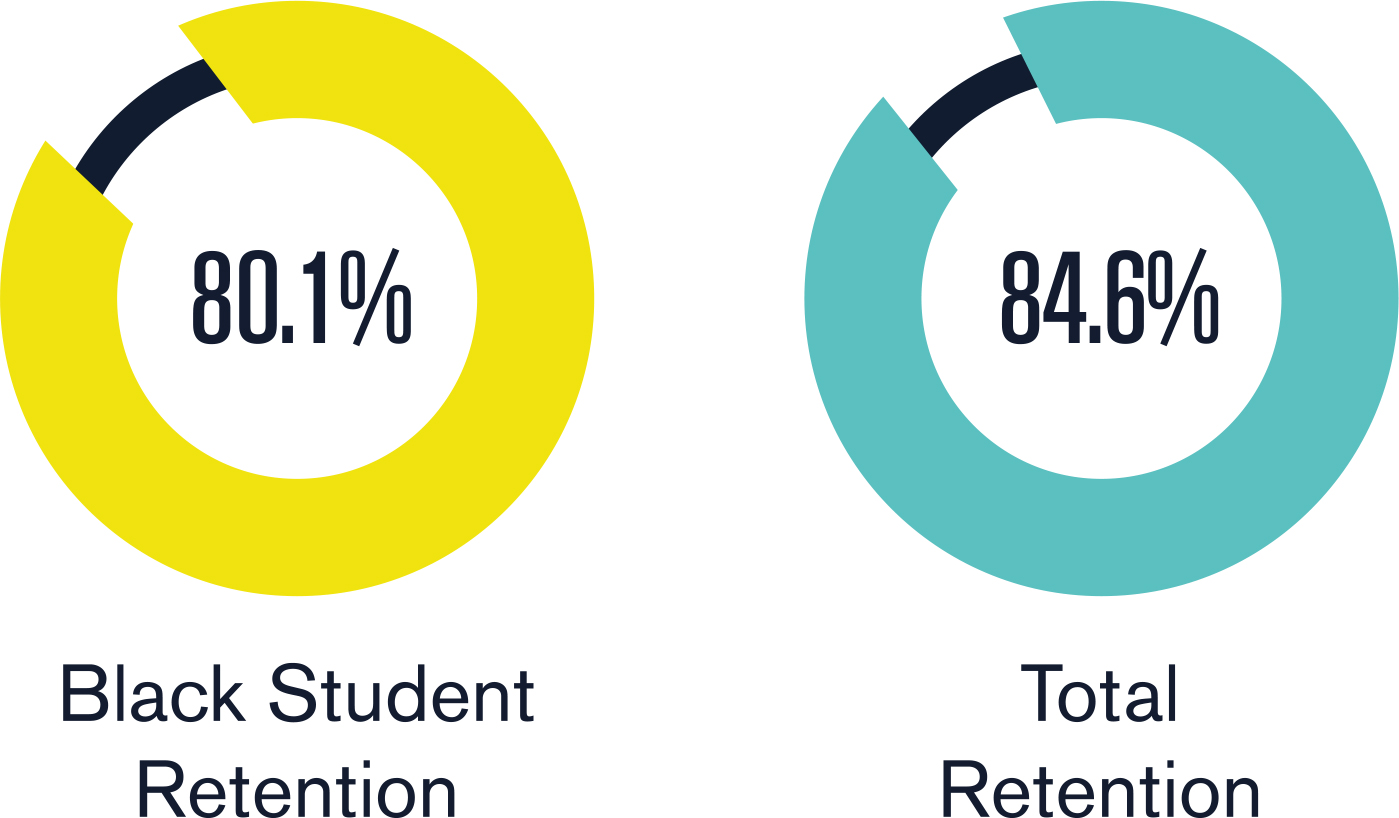
Black Student retention
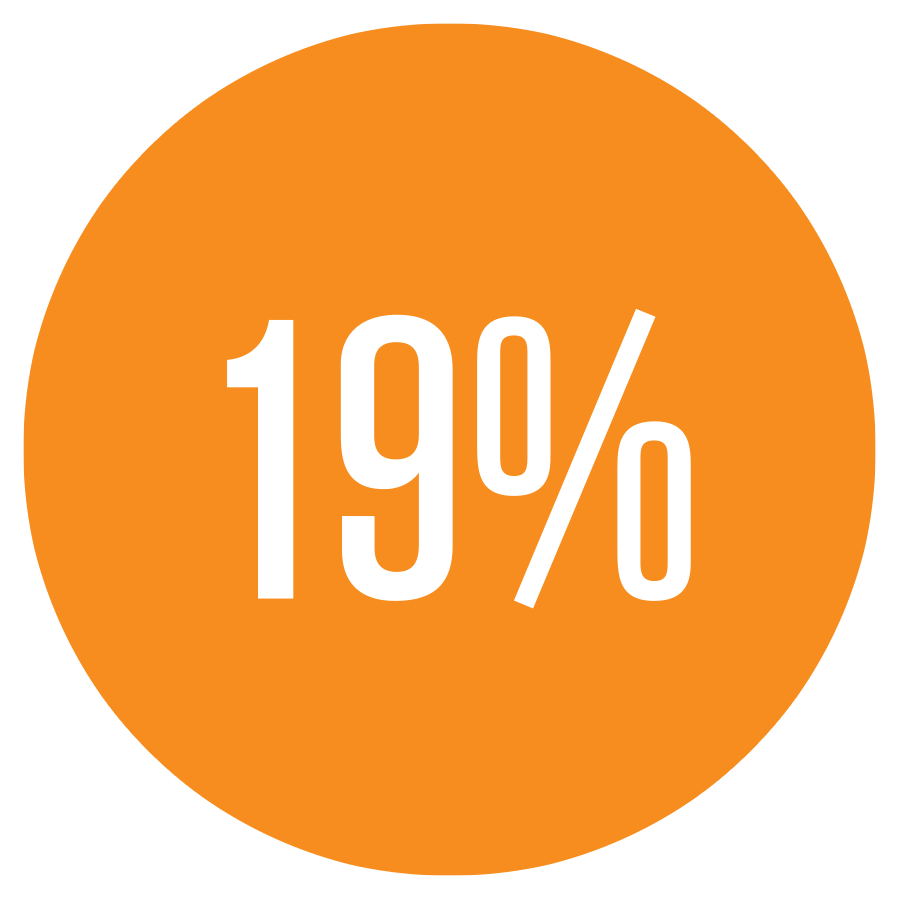
First generation

Veteran or active duty

Greatest resources for minority students — The Princeton Review

ASU enrollment
